ATON INTERSECTS 32.60 METRES OF 3.31 G/T GOLD EQUIVALENT FROM SURFACE AT HAMAMA WEST
Vancouver, November 10, 2016: Aton Resources Inc. (AAN: TSX-V) (“Aton” or the “Company”) is pleased to report the results for another 13 drill holes from the recently completed 38-hole diamond drill campaign, totaling 3,428 metres, at Hamama West. The Company has reported 27 drill holes to date, including these 13 holes, and will release the remaining holes as assays are received and the results consolidated. Hamama West is one of three zones that comprise the Hamama project, situated within Aton’s 100% owned Abu Marawat concession, located in Egypt
Highlights:
- Drill hole AHA-079 encountered 32.60m @ 1.49g/t gold (Au) and 126.9g/t silver (Ag), from 0.70 to 33.30 metres, or 32.60m of 3.31 g/t gold equivalent (AuEq). This drill hole confirms the continuity of oxide mineralization previously intersected in drill holes AHA-015 (39.0m @ 2.22g/t Au and 102g/t Ag) and AHA-016 (27.5m @ 0.69g/t Au and 26.0g/t Ag), see news release dated November 20, 2012.
- Drill hole AHA-085 encountered 18.25m @ 0.78g/t Au and 21.2g/t silver Ag from 0.00 to 18.25 metres, and drill hole AHA-074 encountered 18.23m @ 0.52g/t Au and 12.0g/t Ag from 0.10 to 18.33 metres. These holes continue to demonstrate the presence of gold mineralization at surface in the gold oxide cap.
- Drill hole AHA-087 encountered 35.00m @ 1.20g/t Au and 20.7g/t Ag, from 0.00 to 35.00 metres, or 35.00m of 1.50 g/t AuEq. This drill hole confirms the continuity of oxide mineralization previously intersected in drill hole AHA-013 (13.4m @ 1.00g/t Au and 29.9g/t Ag), see news release dated November 20, 2012.
“Most of these drill holes were planned to test the shallow oxide gold cap at Hamama West and holes 79 and 87 returned excellent results,” stated Mark Campbell, Chief Executive Officer of Aton. “Hole 79 returned 32.60 metres of 3.31 g/t gold equivalent, from surface, and hole 87 returned 35 metres of 1.50 g/t gold equivalent from surface. These results demonstrate the potential for an open-pit, heap-leach scenario at Hamama West. The upcoming NI 43-101 report on Hamama West will help shed further light on this scenario and on Hamama’s overall potential.”
Table 1: Intersections using a 0.25 g/t Au cut off.
Hole ID | From (m) | To (m) | Interval (m) | Au (g/t) | Ag (g/t) | AuEq (g/t)* |
AHA-074 | 0.10 | 18.33 | 18.23 | 0.52 | 12.0 | 0.69 |
AHA-075 | 0.10 | 3.20 | 3.10 | 1.16 | 20.1 | 1.45 |
and | 6.05 | 12.30 | 6.25 | 0.33 | 15.8 | 0.56 |
AHA-076 | 0.00 | 5.50 | 5.50 | 0.78 | 29.5 | 1.20 |
and | 15.00 | 25.75 | 10.75 | 0.49 | 26.8 | 0.87 |
and | 33.77 | 47.20 | 13.43 | 0.48 | 15.6 | 0.70 |
AHA-077 | 18.00 | 27.60 | 9.60 | 1.22 | 57.7 | 2.05 |
AHA-078 | 7.93 | 30.50 | 22.57 | 0.44 | 15.6 | 0.66 |
and | 33.40 | 44.26 | 10.86 | 0.85 | 30.6 | 1.29 |
AHA-079 | 0.70 | 33.30 | 32.60 | 1.49 | 126.9 | 3.31 |
AHA-080 | 39.90 | 42.20 | 2.30 | 0.80 | 31.0 | 1.25 |
AHA-082 | 8.50 | 16.80 | 8.30 | 0.63 | 21.6 | 0.94 |
and | 19.00 | 24.34 | 5.34 | 0.55 | 19.9 | 0.84 |
and | 26.40 | 37.00 | 10.60 | 0.56 | 16.3 | 0.79 |
and | 40.00 | 53.00 | 13.00 | 0.41 | 12.3 | 0.59 |
and | 56.00 | 75.00 | 19.00 | 0.93 | 31.0 | 1.38 |
AHA-083 | 0.00 | 5.00 | 5.00 | 0.30 | 11.5 | 0.47 |
and | 22.00 | 25.00 | 3.00 | 0.27 | 13.9 | 0.47 |
and | 32.00 | 69.60 | 37.60 | 0.53 | 13.7 | 0.73 |
and | 75.30 | 78.00 | 2.70 | 1.76 | 23.4 | 2.10 |
AHA-084 | 0.00 | 5.00 | 5.00 | 0.46 | 13.0 | 0.65 |
and | 11.70 | 31.50 | 19.80 | 0.45 | 16.1 | 0.68 |
AHA-085 | 0.00 | 18.25 | 18.25 | 0.78 | 21.2 | 1.08 |
AHA-086 | 1.00 | 15.00 | 14.00 | 0.35 | 12.8 | 0.53 |
and | 27.00 | 34.00 | 7.00 | 0.94 | 11.4 | 1.10 |
AHA-087 | 0.00 | 35.00 | 35.00 | 1.20 | 20.7 | 1.50 |
and | 72.00 | 76.00 | 4.00 | 0.50 | 7.1 | 0.60 |
*Gold equivalent was calculated using a 69.55 gold-to-silver ratio (source Kitco.com — November 8, 2016) and assumes 100% metallurgical recoveries. Cautionary note: this ratio changes over time.
Table 2: Intersections using a 0.50 g/t Au cut off.
Hole ID | From (m) | To (m) | Interval (m) | Au (g/t) | Ag (g/t) | AuEq (g/t)* |
AHA-074 | 0.10 | 10.60 | 10.50 | 0.63 | 16.3 | 0.86 |
16.25 | 18.33 | 2.08 | 0.67 | 7.9 | 0.78 | |
AHA-075 | 0.10 | 3.20 | 3.10 | 1.16 | 20.1 | 1.45 |
AHA-076 | 15.00 | 18.10 | 3.10 | 0.44 | 16.9 | 0.68 |
21.73 | 24.00 | 2.27 | 1.08 | 61.5 | 1.96 | |
41.90 | 47.20 | 5.30 | 0.74 | 22.2 | 1.06 | |
AHA-077 | 18.00 | 27.60 | 9.60 | 1.22 | 57.7 | 2.05 |
AHA-078 | 7.93 | 11.85 | 3.92 | 0.55 | 35.8 | 1.06 |
14.52 | 17.60 | 3.08 | 0.60 | 17.8 | 0.86 | |
34.30 | 44.26 | 9.96 | 0.90 | 32.1 | 1.36 | |
AHA-079 | 0.70 | 30.40 | 29.70 | 1.61 | 121.2 | 3.35 |
AHA-080 | 39.90 | 42.20 | 2.30 | 0.80 | 31.0 | 1.25 |
AHA-082 | 10.50 | 16.80 | 6.30 | 0.72 | 24.3 | 1.07 |
20.00 | 24.34 | 4.34 | 0.58 | 21.4 | 0.89 | |
26.40 | 31.60 | 5.20 | 0.82 | 18.4 | 1.08 | |
61.00 | 75.00 | 14.00 | 1.14 | 36.9 | 1.67 | |
AHA-083 | 32.00 | 34.00 | 2.00 | 0.63 | 11.3 | 0.79 |
50.00 | 52.00 | 2.00 | 0.79 | 15.2 | 1.01 | |
56.00 | 69.60 | 13.60 | 0.77 | 18.7 | 1.04 | |
75.30 | 78.00 | 2.70 | 1.76 | 23.4 | 2.10 | |
AHA-084 | 0.00 | 3.00 | 3.00 | 0.51 | 10.1 | 0.66 |
14.00 | 21.00 | 7.00 | 0.55 | 17.2 | 0.80 | |
27.00 | 31.50 | 4.50 | 0.61 | 23.0 | 0.94 | |
AHA-085 | 0.00 | 18.25 | 18.25 | 0.78 | 21.2 | 1.08 |
AHA-086 | 13.00 | 15.00 | 2.00 | 0.70 | 10.5 | 0.85 |
28.00 | 34.00 | 6.00 | 1.04 | 12.1 | 1.21 | |
AHA-087 | 0.00 | 35.00 | 35.00 | 1.20 | 20.7 | 1.50 |
*Gold equivalent was calculated using a 69.55 gold-to-silver ratio (source Kitco.com — November 8, 2016) and assumes 100% metallurgical recoveries. Cautionary note: this ratio changes over time.
The locations of the drill holes reported in this release are shown in Figure 1, with selected drill holes also shown in cross-section in Figures 2 and 3. Most of the drill holes being reported herein were planned to test the shallow oxide gold cap. Drill holes AHA-082 and AHA-083 were designed to test the main target zone at greater depth, in both the oxide and sulphide zones; and drill holes AHA-080 and AHA-081 were designed to test the far south-western extension of Hamama West. The locations of the drill holes were designed with the forthcoming mineral resource estimation in mind.
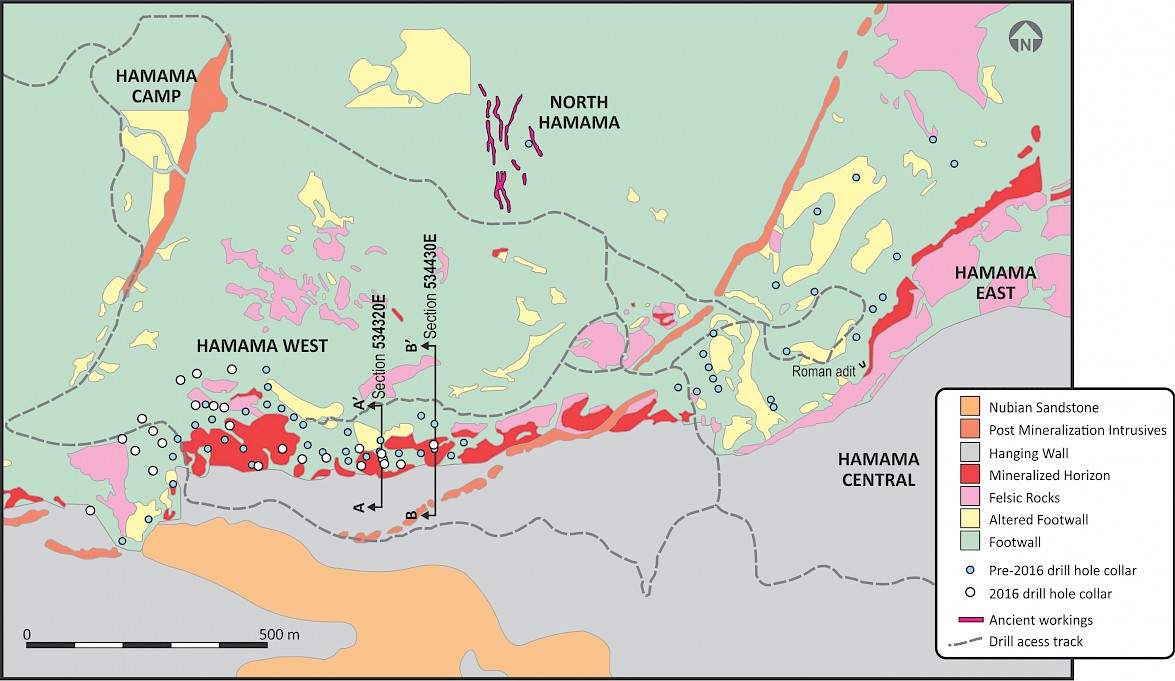
Figure 1. Drill hole plan showing cross sections “A” and “B”.
Cross-section “A” (534320E), see Figure 2, shows the continuous nature of the near surface oxide Au mineralization in the target horizon, consisting of strongly carbonate altered, brecciated and sulphide-bearing felsic volcanic rock types.
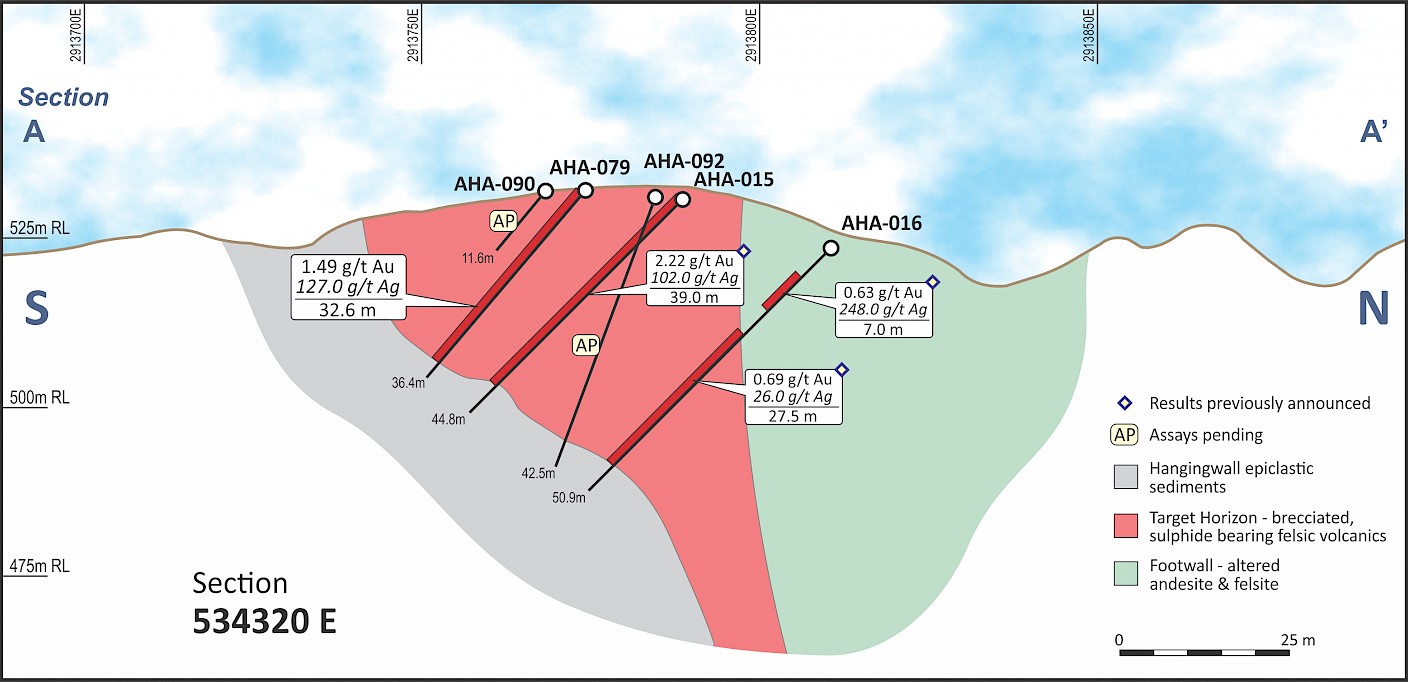
Figure 2. Cross section “A” (534320E)
Cross-section “B” (534430E), see Figure 3, also shows the continuous nature of the near surface oxide Au mineralization in the target horizon, with drill hole AHA-087 confirming the presence of oxide gold cap mineralization to a vertical depth of at least 35m from surface.
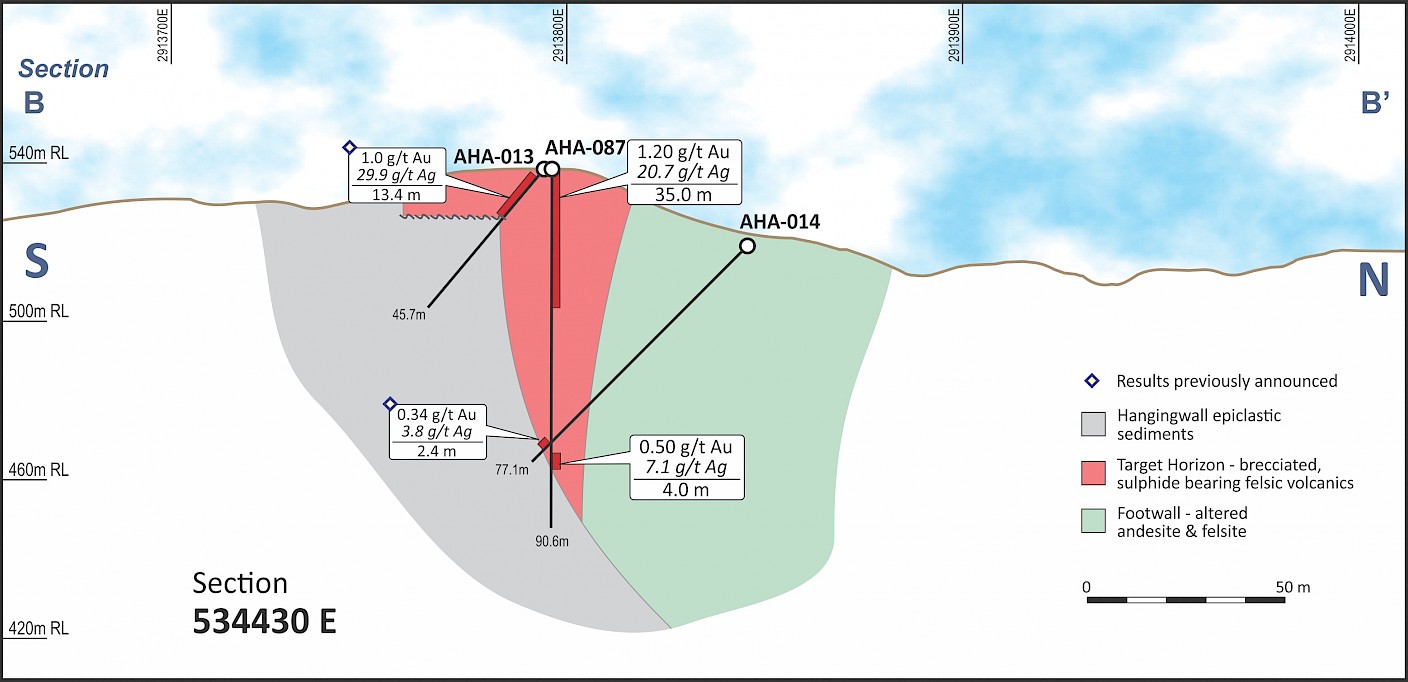
Figure 3. Cross section “B” (534430E)
About the Hamama project
The Hamama project (“Hamama”) is located at the western end of the 40km long gold trend at the Abu Marawat concession and is comprised of three zones, Hamama West, Hamama Central and Hamama East. The mineralized horizon at Hamama has a strike length of approximately 3km and remains open to the west and the east. Mapping indicates that the horizon may extend another 3.2kms to the east, which would more than double Hamama’s current strike length. Further exploration work will be conducted to confirm this. Aton’s most recent exploration activities have been focused at Hamama West, where it recently completed 38 diamond drill holes in 3,428 metres. Hamama West has been deeply weathered into a soft, friable oxidized gossan blanket, referred to as a gold-oxide cap, which is over 900 metres long, up to 110 metres wide and has an average vertical depth of 35 metres. Importantly, sulphide mineralization has been traced up to 180 metres in depth at Hamama West and remains open. Aton plans to announce a NI 43-101 compliant resource for Hamama West by year end.
About Aton Resources Inc.
Aton Resources Inc. (AAN: TSX-V) is focused on its 100% owned Abu Marawat concession, located in Egypt’s Arabian-Nubian Shield, approximately 400km north of Centamin’s Sukari gold mine. Aton has identified a 40km long gold trend at Abu Marawat, anchored by the Hamama project in the west and the Abu Marawat gold deposit in the east. In addition to the Hamama project and the Abu Marawat gold deposit, the trend contains numerous gold exploration targets, including two historic gold mines. Abu Marawat is over 738 sq. km in size and is located in an area of excellent infrastructure, a four-lane highway, railway line, a 220kV power line and a water pipeline are in close proximity.
Qualified Person
The technical information contained in this News Release was prepared by Roderick Cavaney BSc, MSc (hons), MSc (Mining & Exploration Geology), AusIMM (f), SEG, GSA, SME, Exploration Manager for Aton Resources Inc. Mr. Cavaney is a qualified person (QP) under National Instrument 43-101 Standards of Disclosure for Mineral Projects.
For further information regarding Aton Resources Inc., please contact:
Mark Campbell
President and Chief Executive Officer
Tel: +1-936-689-2589
Email: mcampbell@atonresources.com
Blaine Monaghan
Vice President, Investor Relations
Tel: +1 (604) 331-5092
Email: ir@atonresources.com
Note Regarding Forward-Looking Statements
Some of the statements contained in this release are forward-looking statements. Since forward- looking statements address future events and conditions; by their very nature they involve inherent risks and uncertainties. Actual results in each case could differ materially from those currently anticipated in such statements.
Neither TSX Venture Exchange nor its Regulation Services Provider (as that term is defined in policies of the TSX Venture Exchange) accepts responsibility for the adequacy or accuracy of this release.