Aton announces the final results from the resource infill RC drilling programme at Hamama West
Vancouver, BC, October 20, 2022: Aton Resources Inc. (AAN: TSX-V) (“Aton” or the “Company”) is pleased to update investors on the final results from the RC drilling programme at its Hamama West gold-silver project, located in the Company’s 100% owned Abu Marawat Concession (“Abu Marawat” or the “Concession”), in the Eastern Desert of Egypt.
Highlights:
- Assay results have now been received for the final 42 RC drill holes, HAP-163 to HAP-204;
- Significant intersections include the following:
- 1.43 g/t Au, 89.86 g/t Ag and 2.48 g/t AuEq over a 20m interval, from surface (drill hole HAP-163);
- 0.82 g/t Au, 18.80 g/t Ag and 1.04 AuEq over an 80m interval, from surface (hole HAP-167);
- 1.57 g/t Au, 29.99 g/t Ag and 1.92 AuEq over a 47m interval, from 26m depth (hole HAP-192);
- 0.54 g/t Au, 55.12 g/t Ag and 1.19 g/t AuEq over a 49m interval, from 76m depth (hole HAP-195).
“We are surely pleased to be able to report the final results from the successful infill RC drilling programme at Hamama” said Tonno Vahk, Interim CEO. “Not only have we confirmed high grade quartz veins in new drilling at West Garida, but the Hamama West results have been good, and we certainly believe that the drilling has achieved its objective in terms of allowing us to upgrade the confidence of the inferred resource at Hamama. The ongoing diamond drilling programme at Rodruin is nearly complete, and as soon as it is finished the rig will then relocate to the Hamama area, where it will start testing currently undrilled oxide mineralisation at Hamama East. Now that we have the final assay results in, we will soon be able to start on updating the Hamama West mineral resource estimate, before we get on to the maiden Rodruin MRE. We continue to work closely with our partners, the Egyptian Mineral Resources Authority, as we follow the plan agreed with them, and move steadily forward, and towards our common goal of establishing new gold mines at Hamama and Rodruin.”
Hamama West RC drilling programme
The Hamama West project has an indicated resource of 137,000 ounces of gold equivalent (“AuEq”, gold and silver combined), and an inferred resource of 341,000 ounces AuEq. The uppermost oxide and transitional component of the Hamama West deposit (the “oxide gold cap”) comprises an inferred resource of 106,000 ounces AuEq (see news release dated January 24, 2017). Metallurgical testwork has indicated average gold recoveries of 75.6% and 72.7% from oxide and transitional mineralisation types respectively (see news release dated February 22, 2018), using standard heap leach processing technology. Aton plans to initially mine the outcropping oxide gold cap of the deposit, which is mineralised directly from surface, as a low capex/opex starter open pit mining operation, with a heap leach processing facility. The Hamama West oxides will provide early cash flow, and will represent the first stage of phased mine development at the Abu Marawat Concession.
The reverse circulation percussion (“RC”) resource infill drilling programme at the Hamama West gold-silver project (Figure 1) was completed on August 24, 2022. The programme was designed to primarily test the oxide gold cap of the Hamama West mineral resource estimate (“MRE”), with the specific objective of upgrading the confidence of the existing inferred resource. A total of 6,620m was drilled for the programme, predominantly at the Hamama West zone. 3 holes were completed, for 297m, at the Western Carbonate zone, approximately 400m west of Hamama West. 5 holes were drilled at the West Garida prospect approximately 3km east of Hamama West, for 390m, (see news release dated September 1, 2022), with the remaining 5,933m drilled at Hamama West.
Previous oxide gold cap drilling intersections from the programme include 2.90 g/t Au, 68.9 g/t Ag and 3.71 g/t AuEq over a 37m interval, from surface (drill hole HAP-115), 2.87 g/t Au, 54.3 g/t Ag and 3.51 AuEq over a 22m interval, from 1m depth (hole HAP-110), and 3.71 g/t Au, 258.4 g/t Ag and 6.75 g/t AuEq over a 12m interval, also from surface (drill hole HAP-137), see news releases dated August 26, 2022 and September 27, 2022.
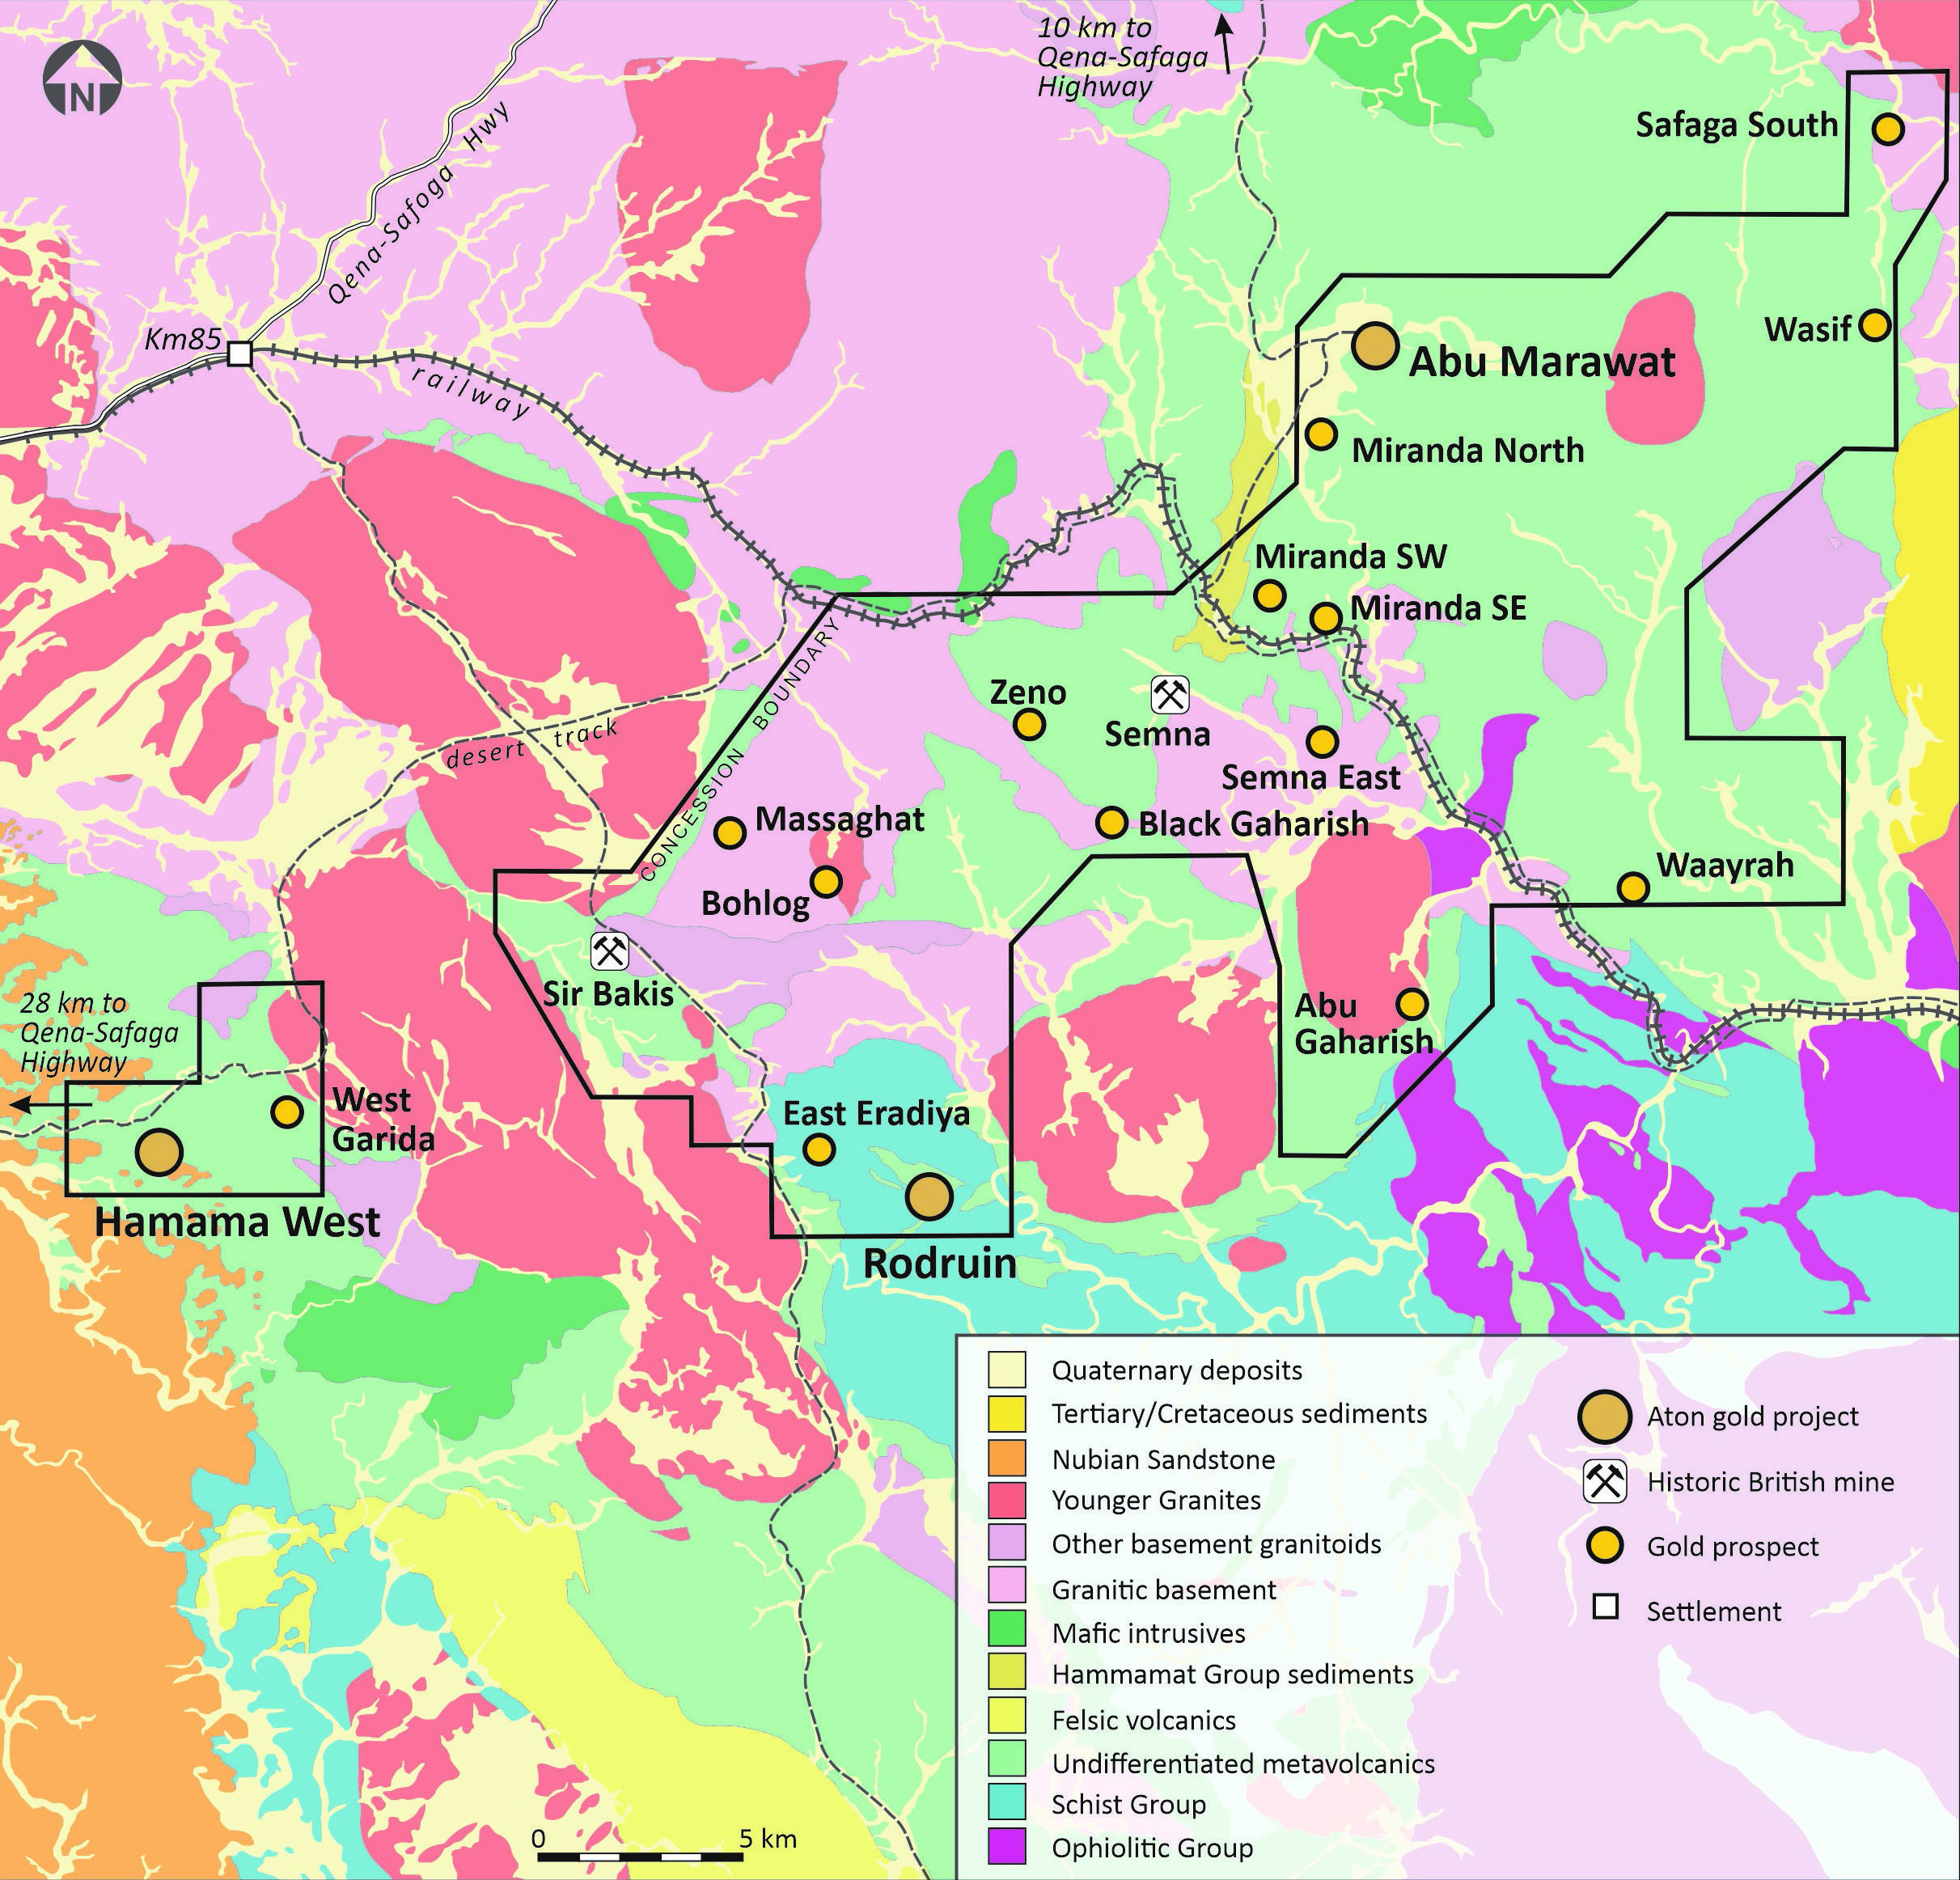
Figure 1: Geology plan of the Abu Marawat Concession, showing the location of the Hamama West project
Drill holes were laid out using handheld GPS, with all collars surveyed on the completion of the programme by total station. Drill holes were down hole surveyed at appropriate intervals using a Champ GyroTM north-seeking gyroscopic survey tool. The locations of the Hamama West drill holes are shown in Figure 2, and collar details of holes HAP-163 to HAP-204 are provided in Appendix A.
Results
Selected significant intersections from the holes HAP-163 to HAP-204 are shown below in Table 1, and full results from all holes are provided in Appendix B.

Figure 2: Hamama West RC drilling programme – drill hole collar plan (red: 2022 RC holes reporting; blue: 2022 RC holes, previously reported; white: pre-2022 diamond drill holes)
Hole ID | Intersection (m) 1 | Au (g/t) | Ag (g/t) | AuEq 2 | Comments | ||
From | To | Interval | |||||
HAP-163 | 0 | 20 | 20 | 1.43 | 89.86 | 2.48 | Oxide resource |
HAP-164 | 0 | 23 | 23 | 1.00 | 43.48 | 1.51 | Oxide resource |
HAP-166 | 0 | 31 | 31 | 0.66 | 30.16 | 1.01 | Oxide resource |
HAP-167 | 0 | 80 | 80 | 0.82 | 18.80 | 1.04 | Oxide/sulphide resource |
HAP-169 | 0 | 32 | 32 | 0.81 | 33.33 | 1.20 | Oxide resource |
HAP-170 | 0 | 24 | 24 | 0.88 | 46.13 | 1.43 | Oxide resource |
HAP-173 | 0 | 21 | 21 | 0.87 | 34.59 | 1.28 | Oxide resource |
HAP-176 | 0 | 33 | 33 | 0.72 | 26.09 | 1.03 | Oxide resource |
HAP-181 | 0 | 12 | 12 | 1.68 | 187.4 | 3.88 | Crocs Nose Zone |
HAP-191 | 19 | 40 | 21 | 1.73 | 21.15 | 1.98 | Hole ended in mineralisation |
HAP-192 | 26 | 73 | 47 | 1.57 | 29.99 | 1.92 | Oxide/sulphide zone |
HAP-194 | 57 | 80 | 23 | 1.33 | 52.56 | 1.95 | Oxide/sulphide zone |
HAP-195 | 76 | 125 | 49 | 0.54 | 55.12 | 1.19 | Sulphide zone |
HAP-199 | 18 | 103 | 85 | 0.65 | 16.01 | 0.84 | Oxide/sulphide zone |
Notes:
| |||||||
Table 1: Selected mineralised intersections from RC percussion holes HAP-163 to HAP-204
Holes HAP-163 to HAP-176 were all drilled to test the outcropping oxide gold cap of the deposit, which represents the oxide and transitional portion of the Hamama West inferred mineral resource. All these holes intersected zones of Au-Ag mineralisation from surface, as expected (see Appendix B), except hole HAP-172, which was collared on the structural footwall contact of the mineralised zone. Intersections included 1.43 g/t Au, 89.86 g/t Ag and 2.48 g/t AuEq over a 20m interval (drill hole HAP-163), and 0.82 g/t Au, 18.80 g/t Ag and 1.04 g/t AuEq over an 80m interval (drill hole HAP-163, in oxide and underlying sulphide zones), with both intersections from surface.
Holes HAP-177 to HAP-190 were all drilled to test an interpreted shallowly west-dipping fault zone which truncates the western margin of the main Hamama West deposit, and sinistrally displaces the oxide gold cap about 200m to the south. Several of the holes intersected narrow zones of near surface mineralisation, outside of the existing MRE, and can be expected to add minor incremental tonnes to the revised MRE. Mineralised intersections included 1.68 g/t Au, 187.4 g/t Ag and 3.88 g/t AuEq over a 12m interval from surface (drill hole HAP-181), and 3.50 g/t Au, 34.17 g/t Ag and 3.91 g/t AuEq over an 3m interval, from 2m depth (hole HAP-179).
Holes HAP-191 to HAP-194 were all drilled to test the interpreted extension of the main Hamama West mineralised zone beneath the west-dipping fault zone at the western margin of the deposit. All 4 of the holes intersected mineralisation, with hole HAP-193 finishing in the mineralised zone. Intersections included 1.57 g/t Au, 29.99 g/t Ag and 1.92 g/t AuEq over a 47m interval from 26m depth (drill hole HAP-192), and 1.33 g/t Au, 52.56 g/t Ag and 1.95 g/t AuEq over a 23m interval from 57m depth (hole HAP-194). These 4 holes confirm the depth continuity of the Hamama West deposit, further to the west of the surface outcrop of the mineralisation.
Holes HAP-195 to HAP-201 were drilled to test potential deeper sulphide mineralisation outside the existing sulphide MRE. Several holes failed to intersect significant mineralisation, but not all the holes reached the target due to the depth limit of the rig, which could reach a maximum of 238m. Significant mineralised intersections included 0.54 g/t Au, 55.12 g/t Ag and 1.19 g/t AuEq over a 49m interval from 76m depth (hole HAP-195) and 0.65 g/t Au, 16.01 g/t Ag and 0.84 g/t AuEq over an 85m interval from 18m depth (both oxide and sulphide zone mineralisation in hole HAP-199).
3 holes were drilled to test weak discontinuous, mineralisation sampled at surface at the Western Carbonate zone. None of the 3 holes, HAP-202 to HAP-204, intersected significant mineralisation.
Sampling and analytical procedures
The RC holes were drilled at 140mm diameter, and the bulk percussion chip samples were collected directly into pre-written large plastic bags from the cyclone every metre, numbered with the hole number and hole depths, and laid out sequentially at the drill site. Between each metre of drilling the cyclone and top box were cleaned out with compressed air. The bags were then moved to a logging and storage area where the chips were logged by Aton geologists. The bulk 1m samples were weighed, and subsequently riffle split through a 3-tier splitter onsite by Aton field staff to produce an approximately 1/8 split, which was collected in cloth bags, numbered and tagged with the hole number and depth. The splitter was cleaned with compressed air between each sample. The reject material from this initial bulk split was re-bagged, labelled and tagged, and the bulk reject samples will be stored and retained on site at Hamama. A representative sample of each metre was washed, stored in marked plastic chip trays, each containing 20m of samples, photographed, and retained onsite as a permanent record of the drill hole.
All the 1m split samples were weighed again, and the samples were riffle split onsite at the Hamama sample preparation facility, typically a further 3-4 times using a smaller lab splitter, to produce a nominal c. 250-500g sample split for dispatch to the assay laboratory. Again the splitter was cleaned with compressed air between each sample. The laboratory splits were allocated new sample numbers.
QAQC samples are inserted into the sample stream at a rate of approximately 1 certified reference material (or “standard” sample) every 30 samples, 1 blank sample every 15 samples, and 1 field duplicate split sample every 15 samples.
The c. 250-500g split samples were shipped to ALS Minerals sample preparation laboratory at Marsa Alam, Egypt, where they were pulverised to a size fraction of better than 85% passing 75 microns. From this pulverised material a further sub-sample was split off with a nominal c. 50g size, which was shipped on to ALS Minerals at Rosia Montana, Romania for analysis.
Samples were analysed for gold by fire assay with an atomic absorption spectroscopy (“AAS”) finish (analytical code Au-AA23), and for silver using an aqua regia digest followed by an AAS finish (analytical code Ag-AA45). Any high grade gold samples (Au >10 g/t) were re-analysed using analytical code Au-GRA21 (also fire assay, with a gravimetric finish). High grade Ag samples (Ag >100 g/t) were re-analysed using the ore grade technique Ag-AA46 (also an aqua regia digest followed by an AAS finish).
About Aton Resources Inc.
Aton Resources Inc. (AAN: TSX-V) is focused on its 100% owned Abu Marawat Concession (“Abu Marawat”), located in Egypt’s Arabian-Nubian Shield, approximately 200 km north of Centamin’s world-class Sukari gold mine. Aton has identified numerous gold and base metal exploration targets at Abu Marawat, including the Hamama deposit in the west, the Abu Marawat deposit in the northeast, and the advanced Rodruin exploration prospect in the south of the Concession. Two historic British gold mines are also located on the Concession at Sir Bakis and Semna. Aton has identified several distinct geological trends within Abu Marawat, which display potential for the development of a variety of styles of precious and base metal mineralisation. Abu Marawat is 447.7 km2 in size and is located in an area of excellent infrastructure; a four-lane highway, a 220kV power line, and a water pipeline are in close proximity, as are the international airports at Hurghada and Luxor.
Qualified person
The technical information contained in this News Release was prepared by Javier Orduña BSc (hons), MSc, MCSM, DIC, MAIG, SEG(M), Exploration Manager of Aton Resources Inc. Mr. Orduña is a qualified person (QP) under National Instrument 43-101 Standards of Disclosure for Mineral Projects.
For further information regarding Aton Resources Inc., please visit us at www.atonresources.com or contact:
TONNO VAHK
Interim CEO
Tel: +1 604 318 0390
Email: info@atonresources.com
Note Regarding Forward-Looking Statements
Some of the statements contained in this release are forward-looking statements. Since forward-looking statements address future events and conditions; by their very nature they involve inherent risks and uncertainties. Actual results in each case could differ materially from those currently anticipated in such statements.
Neither TSX Venture Exchange nor its Regulation Services Provider (as that term is defined in policies of the TSX Venture Exchange) accepts responsibility for the adequacy or accuracy of this release.
Appendix A – RC drill hole collar details
Hole ID | Collar co-ordinates 1 | Dip 2 | Grid azimuth 2 | EOH depth (m) | Comments | ||
X | Y | Z | |||||
HAP-163 | 533966.6 | 2913771.1 | 513.8 | -55 | 180 | 20 | Targeting oxide resource |
HAP-164 | 533966.3 | 2913781.1 | 513.9 | -55 | 180 | 30 | Targeting oxide resource |
HAP-165 | 533968.1 | 2913794.4 | 514.6 | -55 | 180 | 50 | Targeting oxide resource |
HAP-166 | 533968.3 | 2913811.0 | 514.4 | -55 | 180 | 70 | Targeting oxide resource |
HAP-167 | 534000.3 | 2913802.3 | 518.0 | -90 | 0 | 80 | Targeting oxide resource |
HAP-168 | 534016.4 | 2913790.2 | 518.6 | -75 | 165 | 50 | Targeting oxide resource |
HAP-169 | 533999.7 | 2913791.5 | 518.6 | -55 | 180 | 40 | Targeting oxide resource |
HAP-170 | 533999.8 | 2913782.9 | 518.8 | -55 | 180 | 30 | Targeting oxide resource |
HAP-171 | 533999.7 | 2913772.3 | 518.4 | -55 | 180 | 18 | Targeting oxide resource |
HAP-172 | 534020.7 | 2913762.4 | 514.6 | -55 | 180 | 12 | Targeting oxide resource |
HAP-173 | 534020.9 | 2913771.6 | 514.5 | -70 | 180 | 25 | Targeting oxide resource |
HAP-174 | 534037.1 | 2913774.3 | 513.6 | -55 | 180 | 30 | Targeting oxide resource |
HAP-175 | 534036.9 | 2913756.1 | 517.1 | -55 | 180 | 20 | Targeting oxide resource |
HAP-176 | 534062.1 | 2913769.3 | 520.1 | -90 | 0 | 45 | Targeting oxide resource |
HAP-177 | 533914.3 | 2913699.5 | 510.8 | -60 | 180 | 20 | Western Boundary Fault zone |
HAP-178 | 533912.5 | 2913680.9 | 511.8 | -60 | 180 | 20 | Western Boundary Fault zone |
HAP-179 | 533892.9 | 2913679.9 | 511.9 | -60 | 180 | 30 | Western Boundary Fault zone |
HAP-180 | 533912.6 | 2913662.5 | 514.4 | -60 | 180 | 20 | Western Boundary Fault zone |
HAP-181 | 533894.2 | 2913659.5 | 514.6 | -60 | 180 | 30 | Western Boundary Fault zone |
HAP-182 | 533869.5 | 2913657.5 | 514.9 | -60 | 180 | 30 | Western Boundary Fault zone |
HAP-183 | 533869.4 | 2913672.2 | 514.9 | -60 | 180 | 30 | Western Boundary Fault zone |
HAP-184 | 533870.5 | 2913710.0 | 514.5 | -60 | 180 | 30 | Western Boundary Fault zone |
HAP-185 | 533894.6 | 2913702.8 | 512.5 | -60 | 180 | 30 | Western Boundary Fault zone |
HAP-186 | 533915.1 | 2913720.5 | 510.1 | -60 | 180 | 20 | Western Boundary Fault zone |
HAP-187 | 533916.4 | 2913745.1 | 509.2 | -60 | 180 | 20 | Western Boundary Fault zone |
HAP-188 | 533909.9 | 2913759.5 | 508.9 | -55 | 180 | 15 | Western Boundary Fault zone |
HAP-189 | 533893.5 | 2913743.0 | 512.3 | -60 | 180 | 20 | Western Boundary Fault zone |
HAP-190 | 533895.5 | 2913760.6 | 510.0 | -60 | 180 | 20 | Western Boundary Fault zone |
HAP-191 | 533870.3 | 2913798.7 | 505.6 | -55 | 180 | 40 | |
HAP-192 | 533870.9 | 2913816.1 | 504.7 | -55 | 180 | 80 | |
HAP-193 | 533841.8 | 2913812.4 | 505.1 | -55 | 180 | 70 | |
HAP-194 | 533841.0 | 2913832.6 | 500.2 | -55 | 180 | 110 | |
HAP-195 | 534277.0 | 2913897.2 | 519.6 | -63 | 180 | 157 | Targeting potential sulphides |
HAP-196 | 534276.9 | 2913900.6 | 519.9 | -77 | 180 | 166 | Targeting potential sulphides |
HAP-197 | 534242.9 | 2913917.9 | 526.9 | -79 | 175 | 195 | Targeting potential sulphides |
HAP-198 | 534196.0 | 2913925.8 | 527.7 | -80 | 175 | 238 | Targeting potential sulphides |
HAP-199 | 534050.2 | 2913868.2 | 507.0 | -55 | 175 | 118 | Targeting potential sulphides |
HAP-200 | 534277.6 | 2913900.2 | 519.9 | -85 | 175 | 184 | Targeting potential sulphides |
HAP-201 | 534085.6 | 2913919.9 | 511.4 | -71 | 144 | 230 | Targeting potential sulphides |
HAP-202 | 533401.1 | 2913752.2 | 502.6 | -50 | 180 | 106 | Western Carbonate zone |
HAP-203 | 533520.8 | 2913770.3 | 501.3 | -50 | 180 | 106 | Western Carbonate zone |
HAP-204 | 533640.8 | 2913754.5 | 500.6 | -50 | 180 | 85 | Western Carbonate zone |
Notes:
| |||||||
Appendix B – Significant intersections
Hole ID | Intersection (m) 1 | Au (g/t) | Ag (g/t) | AuEq 2 (g/t) | Comments | ||
From | To | Interval | |||||
HAP-163 | 0 | 20 | 20 | 1.43 | 89.86 | 2.48 | |
HAP-164 | 0 | 23 | 23 | 1.00 | 43.48 | 1.51 | |
HAP-165 | 0 | 19 | 19 | 0.63 | 28.26 | 0.97 | |
HAP-166 | 0 | 31 | 31 | 0.66 | 30.16 | 1.01 | |
and | 39 | 43 | 4 | 0.53 | 8.80 | 0.64 | |
HAP-167 | 0 | 80 | 80 | 0.82 | 18.80 | 1.04 | |
incl. | 0 | 47 | 47 | 0.95 | 22.03 | 1.21 | |
incl. | 54 | 80 | 26 | 0.79 | 17.50 | 1.00 | |
HAP-168 | 0 | 33 | 33 | 0.74 | 19.74 | 0.97 | |
incl. | 8 | 33 | 25 | 0.89 | 21.39 | 1.14 | |
HAP-169 | 0 | 32 | 32 | 0.81 | 33.33 | 1.20 | |
HAP-170 | 0 | 24 | 24 | 0.88 | 46.13 | 1.43 | |
incl. | 0 | 18 | 18 | 1.00 | 55.99 | 1.66 | |
HAP-171 | 0 | 18 | 18 | 0.77 | 49.57 | 1.35 | |
incl. | 0 | 10 | 10 | 1.08 | 69.80 | 1.90 | |
HAP-172 | - | - | - | - | - | - | NSA > 0.58 g/t Au (0-1m) |
HAP-173 | 0 | 21 | 21 | 0.87 | 34.59 | 1.28 | |
HAP-174 | 0 | 14 | 14 | 0.60 | 23.96 | 0.88 | |
HAP-175 | 0 | 9 | 9 | 0.67 | 15.66 | 0.86 | |
HAP-176 | 0 | 33 | 33 | 0.72 | 26.09 | 1.03 | |
incl. | 0 | 20 | 20 | 0.81 | 36.47 | 1.24 | |
HAP-177 | - | - | - | - | - | - | NSA (drilled in hangingwall) |
HAP-178 | - | - | - | - | - | - | NSA (drilled in hangingwall) |
HAP-179 | 2 | 5 | 3 | 3.50 | 34.17 | 3.91 | Western Boundary Fault? |
HAP-180 | - | - | - | - | - | - | NSA |
HAP-181 | 0 | 12 | 12 | 1.68 | 187.4 | 3.88 | Crocs Nose zone |
HAP-182 | 4 | 8 | 4 | 0.68 | 6.03 | 0.75 | Western Boundary Fault? |
and | 27 | 29 | 2 | 0.74 | 61.15 | 1.46 | |
HAP-183 | - | - | - | - | - | - | NSA > 1.33 g/t Au (19-20m) |
HAP-184 | - | - | - | - | - | - | NSA |
HAP-185 | 0 | 5 | 5 | 0.97 | 6.92 | 1.05 | Western Boundary Fault? |
HAP-186 | - | - | - | - | - | - | NSA (drilled in hangingwall) |
HAP-187 | - | - | - | - | - | - | NSA (drilled in hangingwall) |
HAP-188 | 0 | 5 | 5 | 0.44 | 29.28 | 0.79 | Western Boundary Fault? |
HAP-189 | 3 | 7 | 4 | 0.40 | 15.98 | 0.59 | Western Boundary Fault? |
HAP-190 | 0 | 3 | 3 | 1.31 | 21.57 | 1.56 | Western Boundary Fault? |
HAP-191 | 19 | 40 | 21 | 1.73 | 21.15 | 1.98 | Hole ended in mineralisation |
HAP-192 | 26 | 73 | 47 | 1.57 | 29.99 | 1.92 | |
incl. | 39 | 73 | 34 | 2.00 | 37.20 | 2.44 | |
HAP-193 | 40 | 45 | 5 | 0.57 | 15.98 | 0.76 | |
and | 56 | 70 | 14 | 0.86 | 8.81 | 0.96 | Hole ended in mineralisation |
HAP-194 | 57 | 80 | 23 | 1.33 | 52.56 | 1.95 | |
incl. | 57 | 65 | 8 | 3.06 | 134.26 | 4.64 | |
HAP-195 | 76 | 125 | 49 | 0.54 | 55.12 | 1.19 | |
incl. | 93 | 125 | 32 | 0.71 | 34.43 | 1.12 | |
Hole ID | Intersection (m) 1 | Au (g/t) | Ag (g/t) | AuEq 2 (g/t) | Comments | ||
From | To | Interval | |||||
HAP-196 | - | - | - | - | - | - | NSA > 0.33 g/t Au on hangingwall contact |
HAP-197 | 175 | 188 | 13 | 0.75 | 20.64 | 1.00 | |
HAP-198 | - | - | - | - | - | - | No mineralisation |
HAP-199 | 18 | 103 | 85 | 0.65 | 16.01 | 0.84 | |
incl. | 18 | 43 | 25 | 0.52 | 14.91 | 0.70 | |
and incl. | 61 | 103 | 42 | 0.87 | 19.75 | 1.10 | |
HAP-200 | - | - | - | - | - | - | NSA > 0.09 g/t Au on hangingwall contact |
HAP-201 | - | - | - | - | - | - | NSA > 0.82 g/t Au, h/wall contact not reached? |
HAP-202 | - | - | - | - | - | - | Western Carbonate zone |
HAP-203 | 78 | 80 | 2 | 1.56 | 27.90 | 1.89 | Western Carbonate zone |
HAP-204 | - | - | - | - | - | - | Western Carbonate zone |
Notes:
| |||||||